EBASE cat point optimization eval
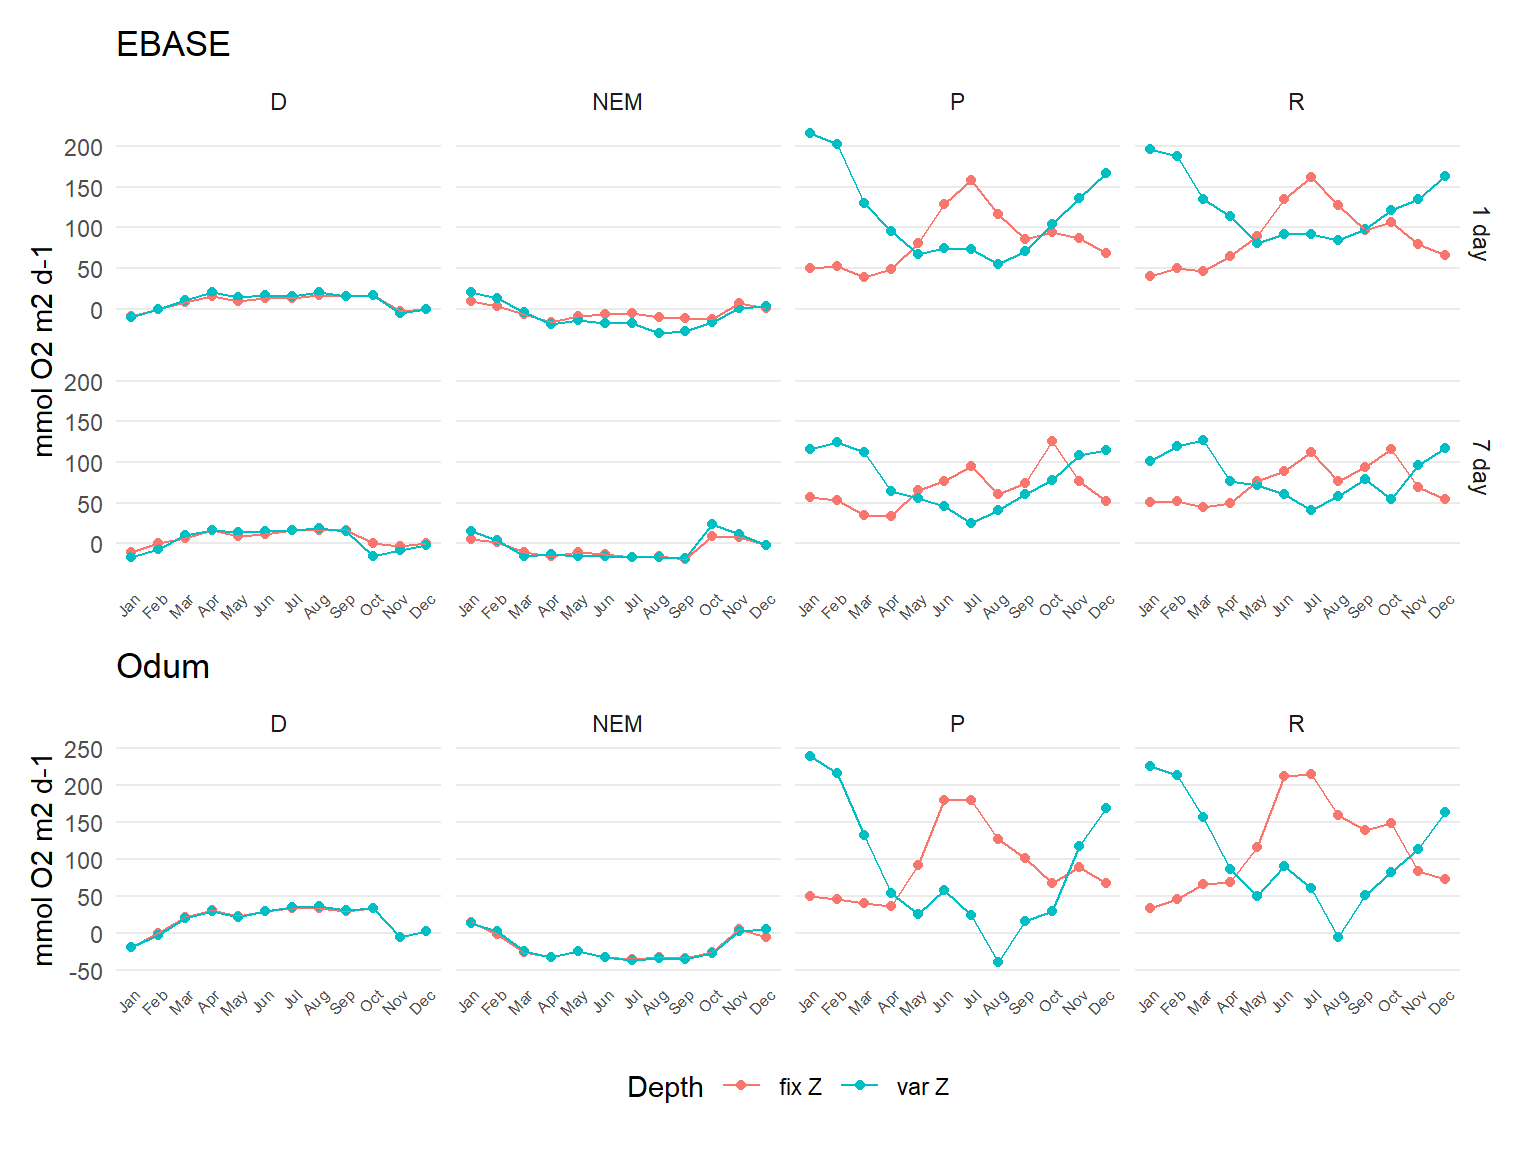
The following shows the effect of changing the optimization period and depth variable used to estimate metabolic parameters with EBASE at Cat Point Station for 2021 data. The optimization periods were 1 or 7 days and depth was fixed as the mean or variable with tidal height. All results are averaged at the monthly scale. The Odum results were also evaluated depth as fixed or variable. All results are based on observed dissolved oxygen data.
Metabolism results for both EBASE and Odum using variable depth show an inverse relationship of P and R with season, where both are lower in the summer, which is counter-intuitive to expectations. The Odum results were not previously inversed using continuous depth, where the results herein used a slightly modified version of the ecometab() function from WtRegDO that converts volumetric dissolved oxygen (mmol O\(_2\) m\(^{-3}\)) to areal dissolved oxygen (mmol O\(_2\) m\(^{-2}\)) using the same approach as EBASE. For both cases, areal dissolved oxygen is calculated prior to estimating any metabolic parameters by simply multiply dissolved oxygen by depth. For variable depth, this is the continuous tidal height vector. An example of the resulting areal dissolved oxygen time series is below using fixed and variable depth.
It can be seen clearly converting volumetric dissolved oxygen to areal using a variable depth severely alters the time series. This superimposes the tidal signal on dissolved oxygen and can mask any biological signal in the observed dissolved oxygen time series. Understandably, the resulting metabolic parameters from this time series will be inaccurate.
However, the lower metabolic parameters in the summer suggests the effect of multiplying dissolved oxygen by tidal height has a systematic effect on the results that varies by season. In other words, the tidal height time series is different in the summer. This may be explained by extracting the tidal harmonics from the tidal height time series.