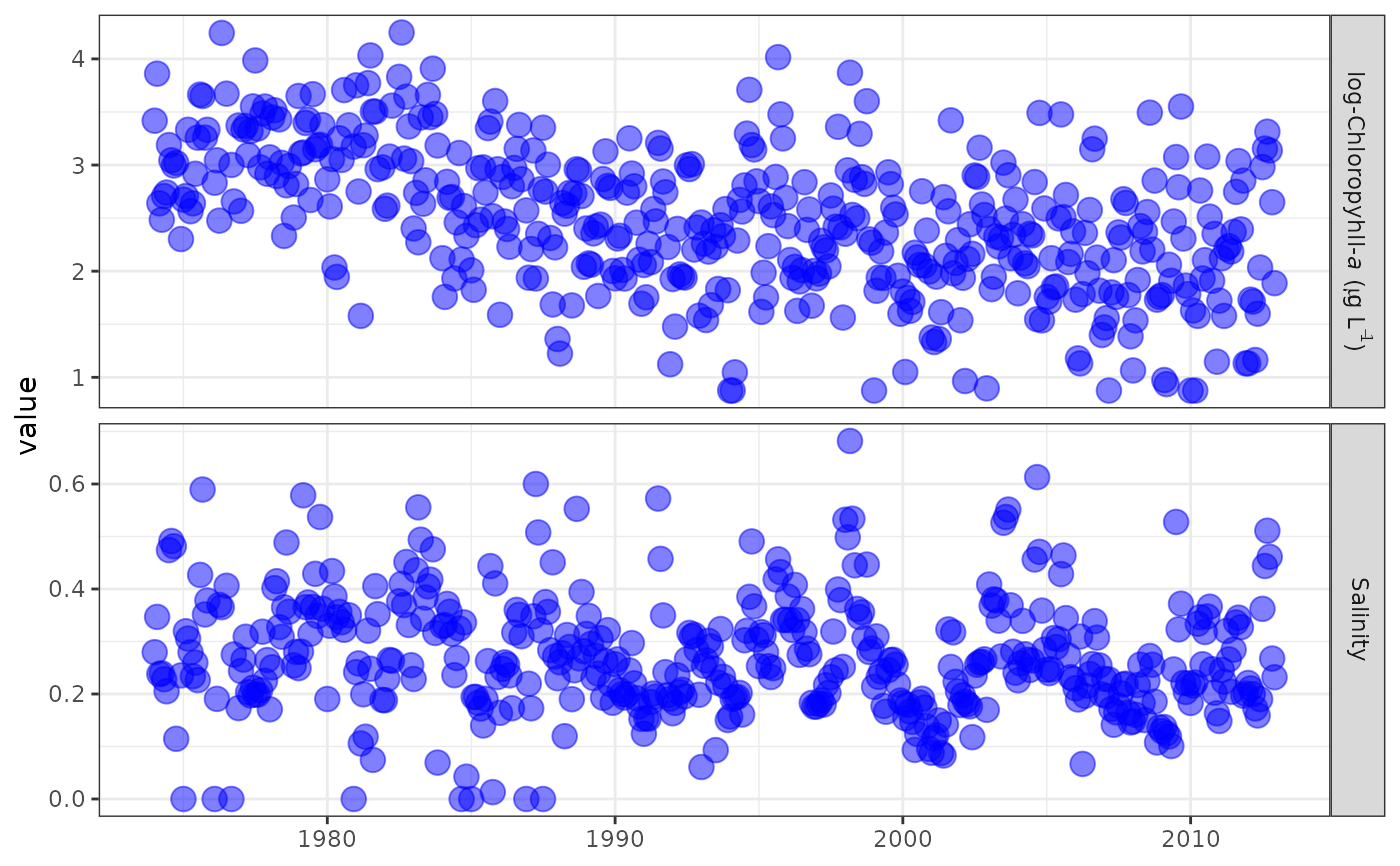
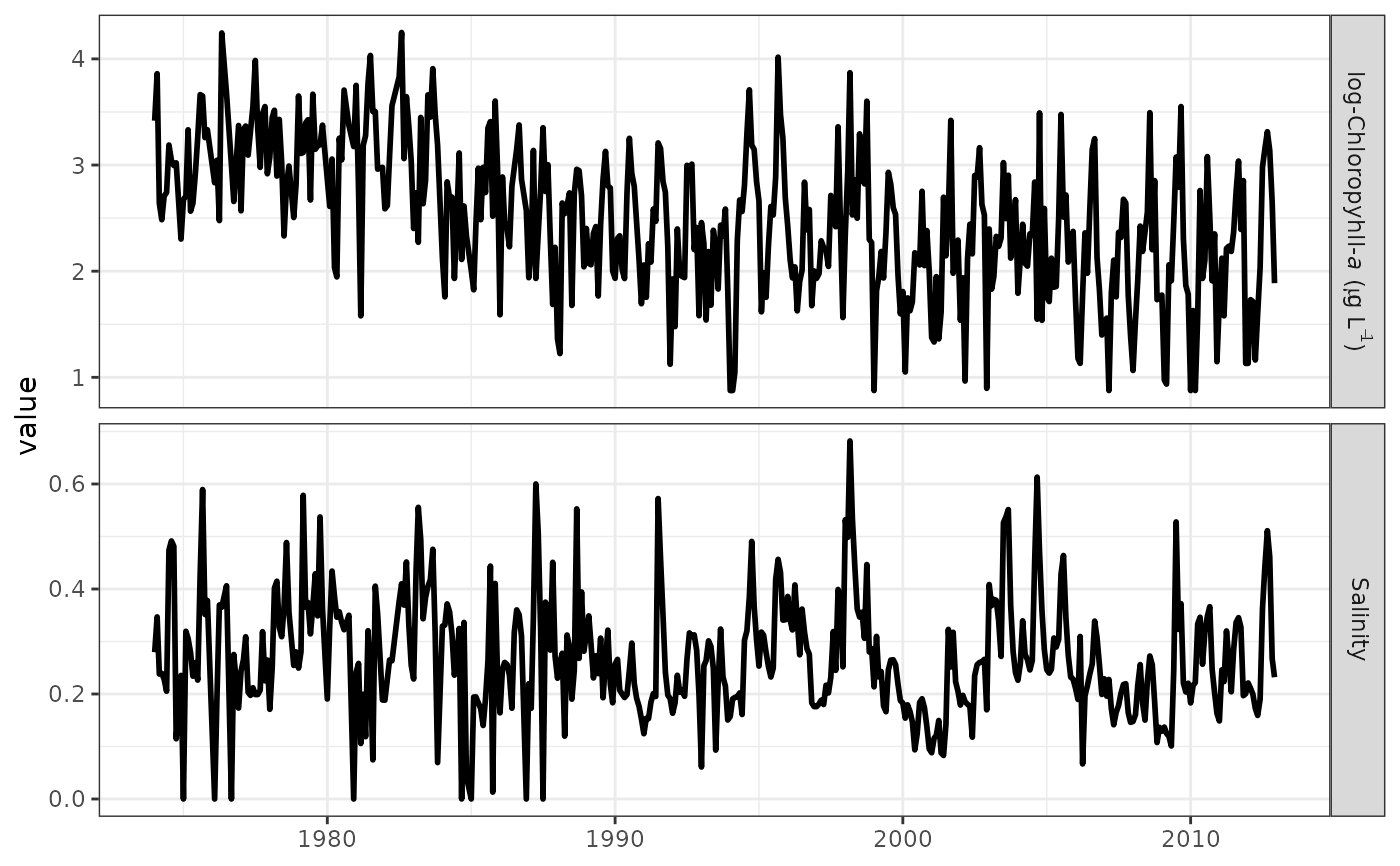
Plot observed response variable and salinity/flow time series from a tidal object
obsplot(dat_in, ...)

# Default S3 method
obsplot(
  dat_in,
  lines = TRUE,
  logspace = TRUE,
  dt_rng = NULL,
  pretty = TRUE,
  col = "black",
  lwd = 1,
  size = 2,
  alpha = 1,
  ...
)

# S3 method for class 'tidal'
obsplot(dat_in, ...)

# S3 method for class 'tidalmean'
obsplot(dat_in, ...)
Arguments
- dat_in
input tidal or tidalmean object
- ...
arguments passed to
geom_line- lines
logical indicating if a line plot is used, otherwise points
- logspace
logical indicating if plots are in log space
- dt_rng
Optional chr string indicating the date range of the plot. Must be two values in the format 'YYYY-mm-dd' which is passed to
as.Date.- pretty
logical indicating if my subjective idea of plot aesthetics is applied, otherwise the
ggplotdefault themes are used- col
chr string of plot color to use
- lwd
numeric value indicating width of lines
- size
numeric value indicating size of points
- alpha
numeric value indicating transparency of points or lines
Value
A ggplot object that can be further modified