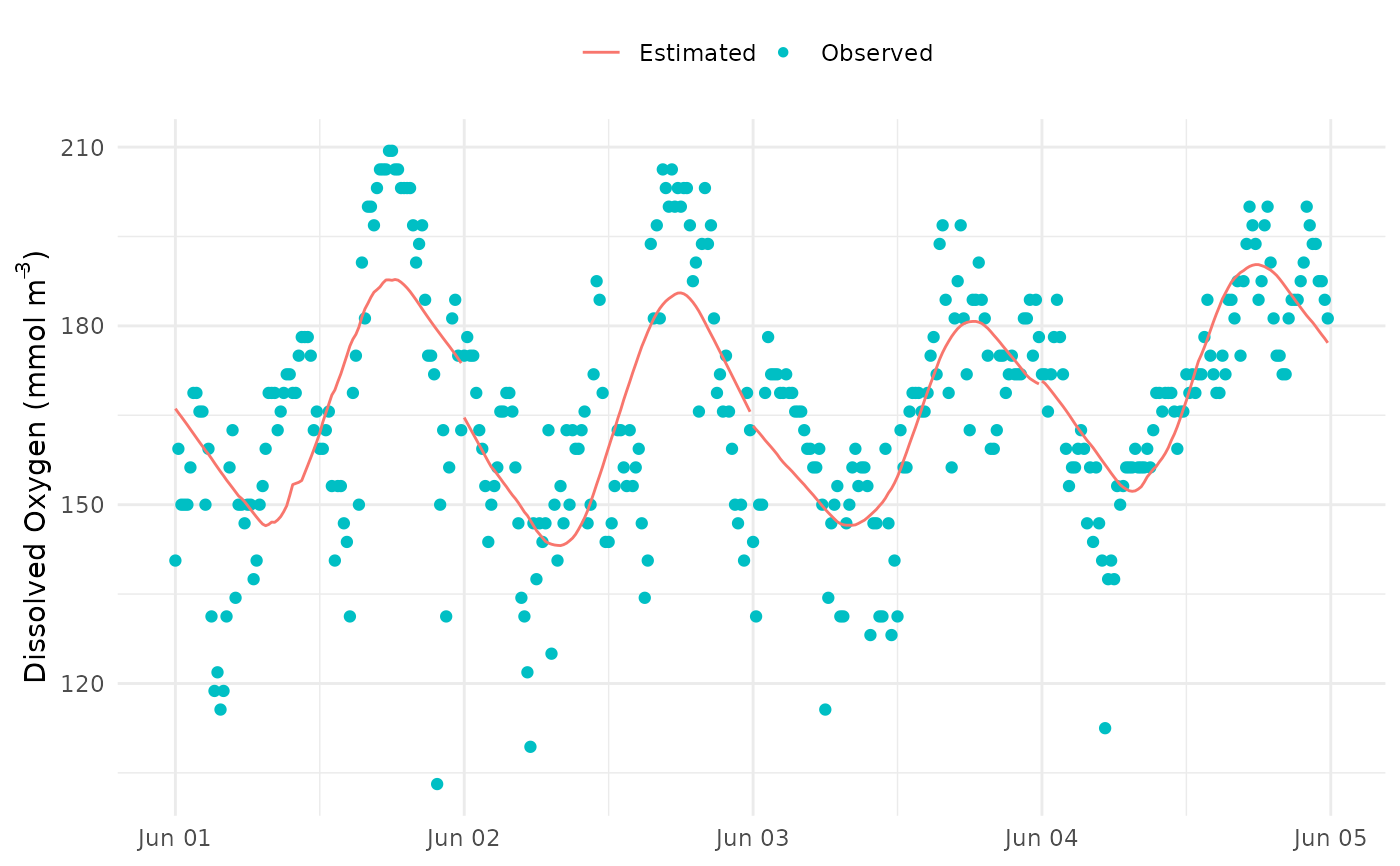
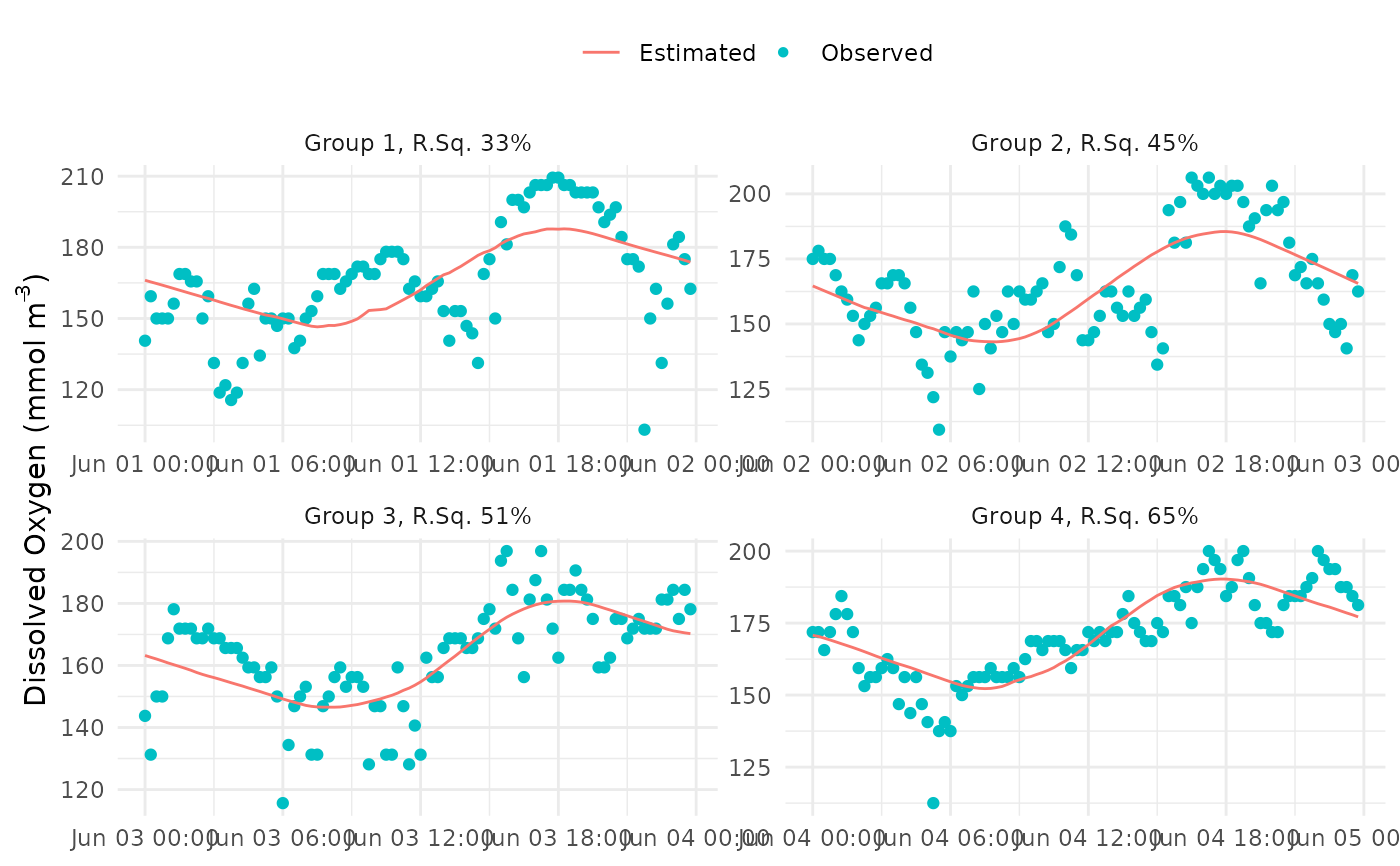
Plot observed and modeled dissolved oxygen
Arguments
- res
output data frame from
ebase- bygroup
logical indicating if the plot is faceted by group
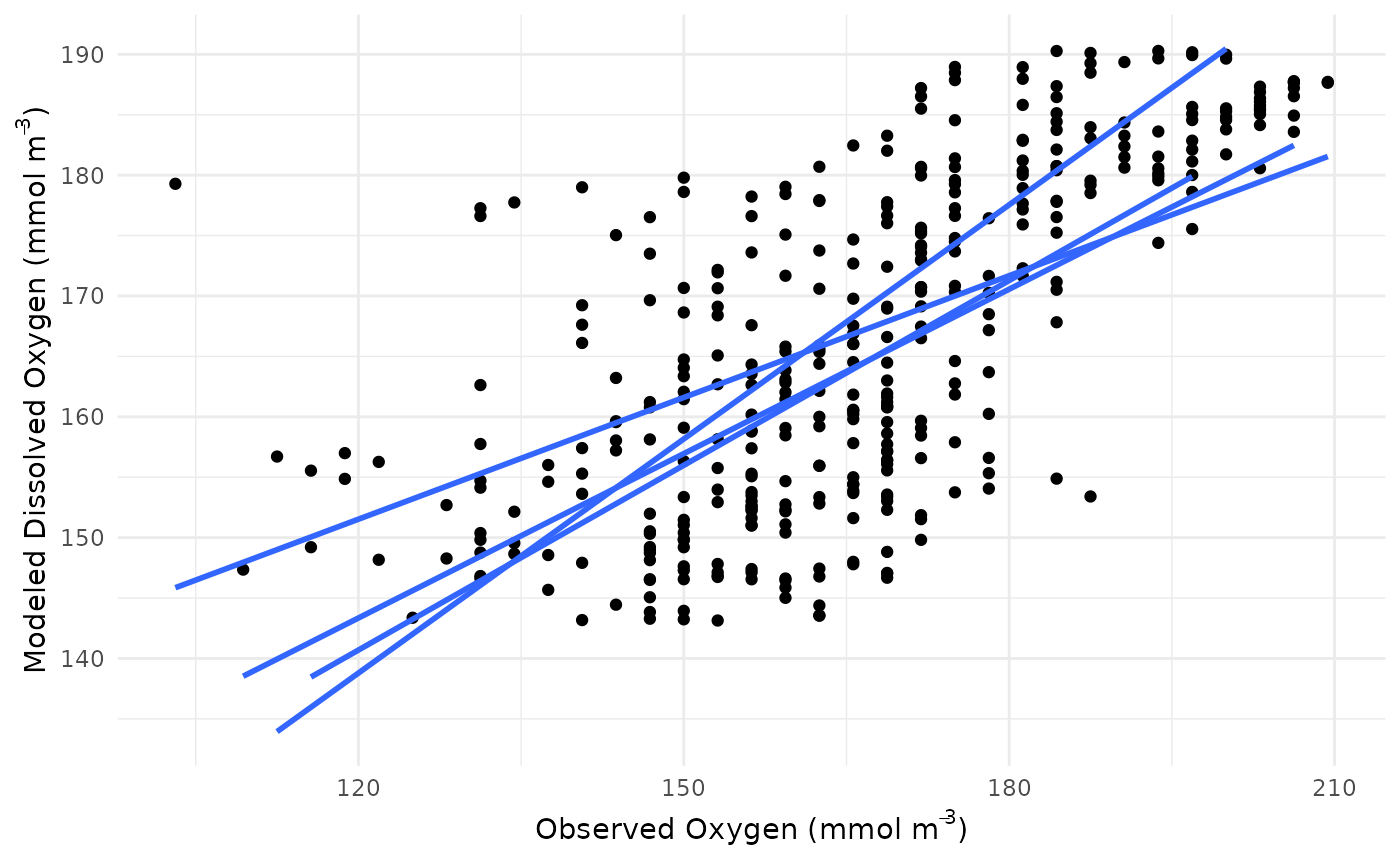
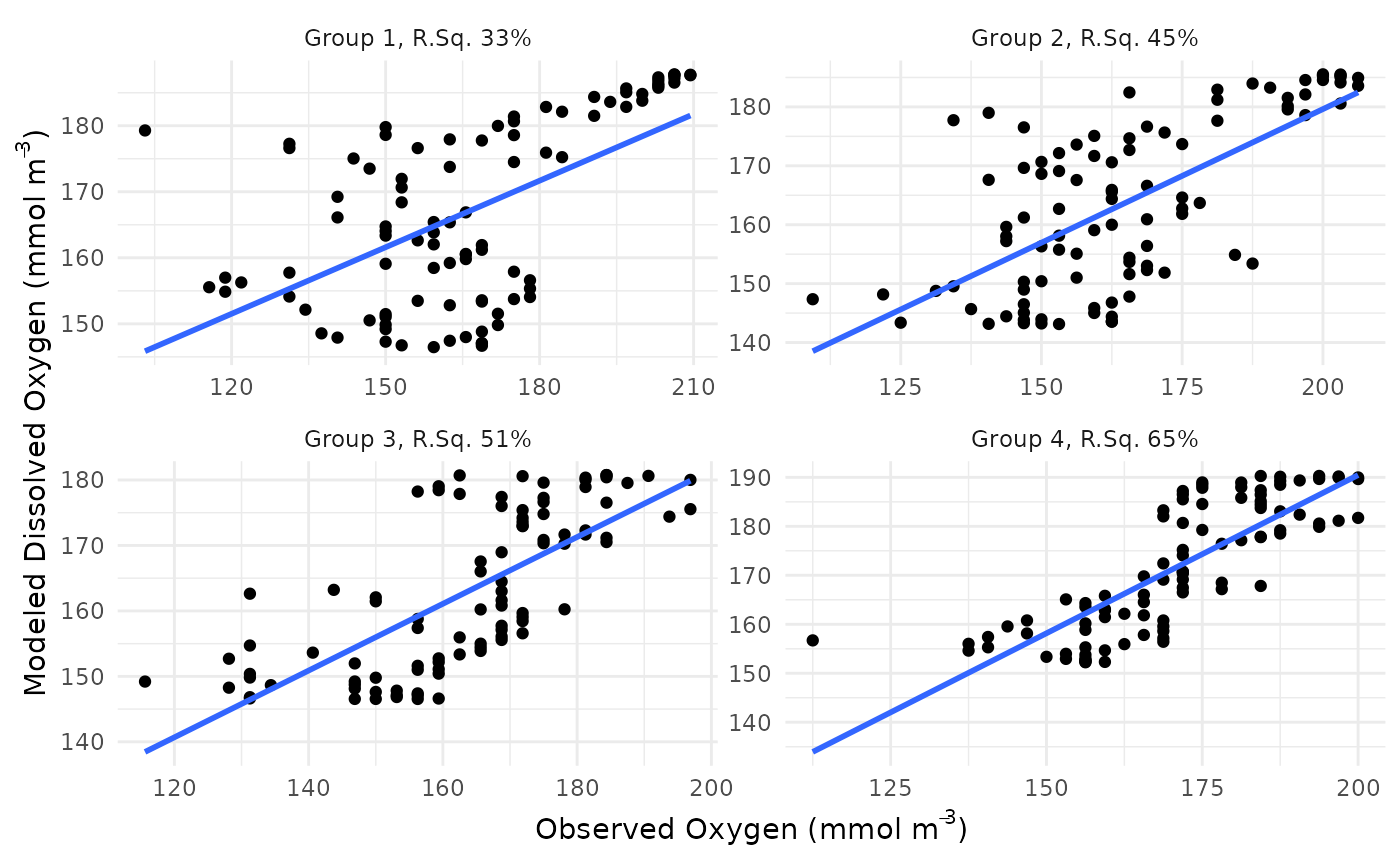
- scatter
logical indicating if a scatter plot of modeled versus estimated dissolved oxygen is returned
- showfit
logical indicating if a linear fit is shown in the plot, applies only if
scatter = TRUE
Value
A ggplot object
Details
Dissolved oxygen (mmol/m3) is plotted as observed from the input data (points) and modeled (lines) based on inputs to ebase if scatter = FALSE. A scatter plot of modeled versus estimated dissolved oxygen is returned if scatter = TRUE, including a linear fit if showfit = TRUE. The plot is faceted by group based on the ndays argument to ebase if bygroup = TRUE. The r-squared value of the fit between modeled and observed dissolved oxygen is also shown in the facet label for the group if bygroup = TRUE.