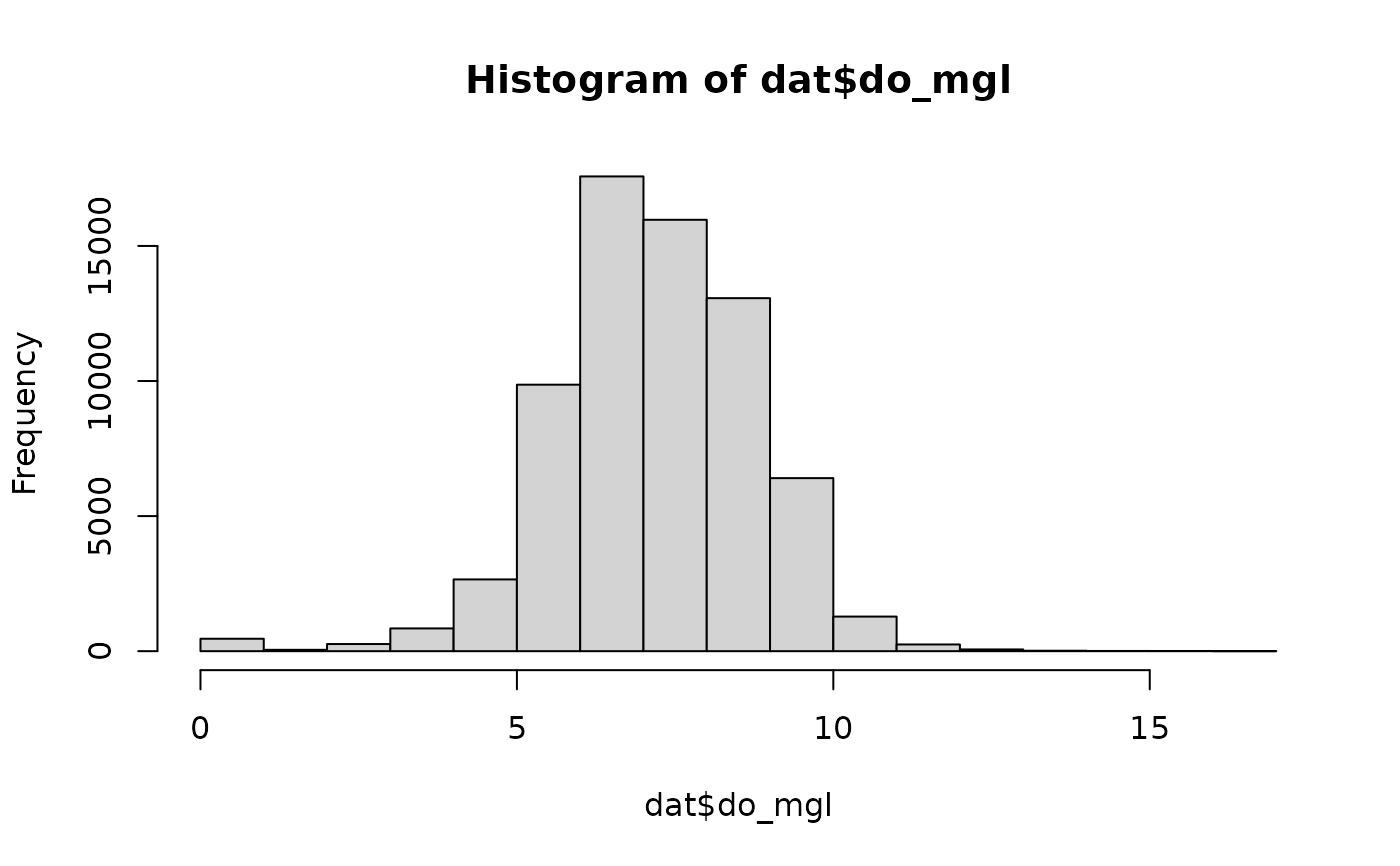
Plot a histogram showing the distribution of a swmpr parameter
Usage
# S3 method for class 'swmpr'
hist(x, ...)
Arguments
- x
input swmpr object
- ...
other arguments passed to
hist
Details
The swmpr method for histograms is a convenience function for the default histogram function. Conventional histogram methods also work well since swmpr objects are also data frames. The input data must contain only one parameter.