Plot a time series of parameters in a swmpr object
Arguments
- x
input swmpr object
- type
chr string for type of plot, default
'l'. Seeplot.- ...
other arguments passed to
par,plot.default
Details
The swmpr method for plotting is a convenience function for plotting a univariate time series. Conventional plotting methods also work well since swmpr objects are also data frames. See the examples for use with different methods.
Examples
## get data
data(apadbwq)
swmp1 <- apadbwq
## subset
dat <- subset(swmp1, select = 'do_mgl',
subset = c('2013-07-01 00:00', '2013-07-31 00:00'))
## plot using swmpr method, note default line plot
plot(dat)
 ## plot using formula method
plot(do_mgl ~ datetimestamp, dat)
## plot using formula method
plot(do_mgl ~ datetimestamp, dat)
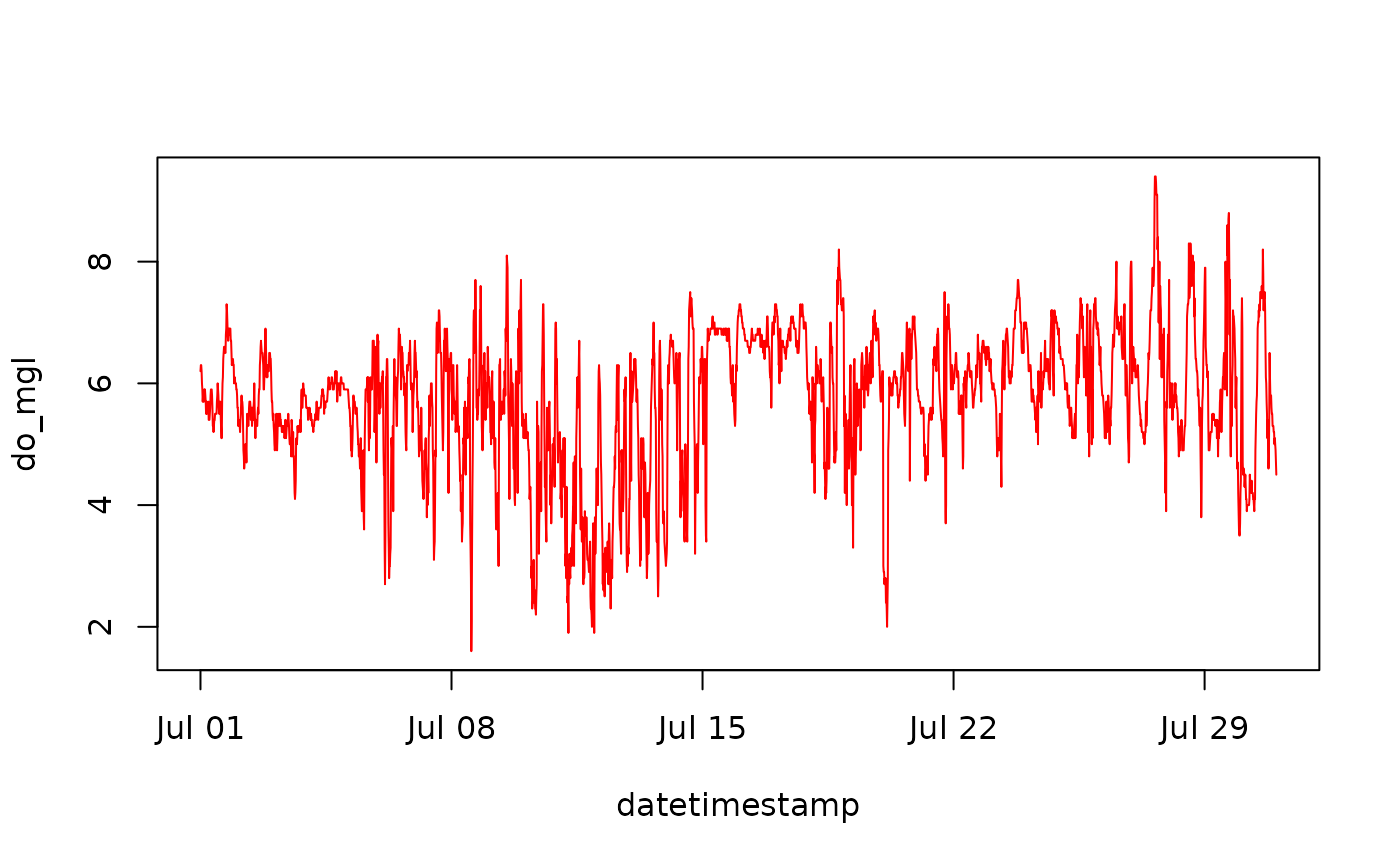
 ## plot using default, add lines
plot(dat, type = 'n')
lines(dat, col = 'red')
## plot using default, add lines
plot(dat, type = 'n')
lines(dat, col = 'red')