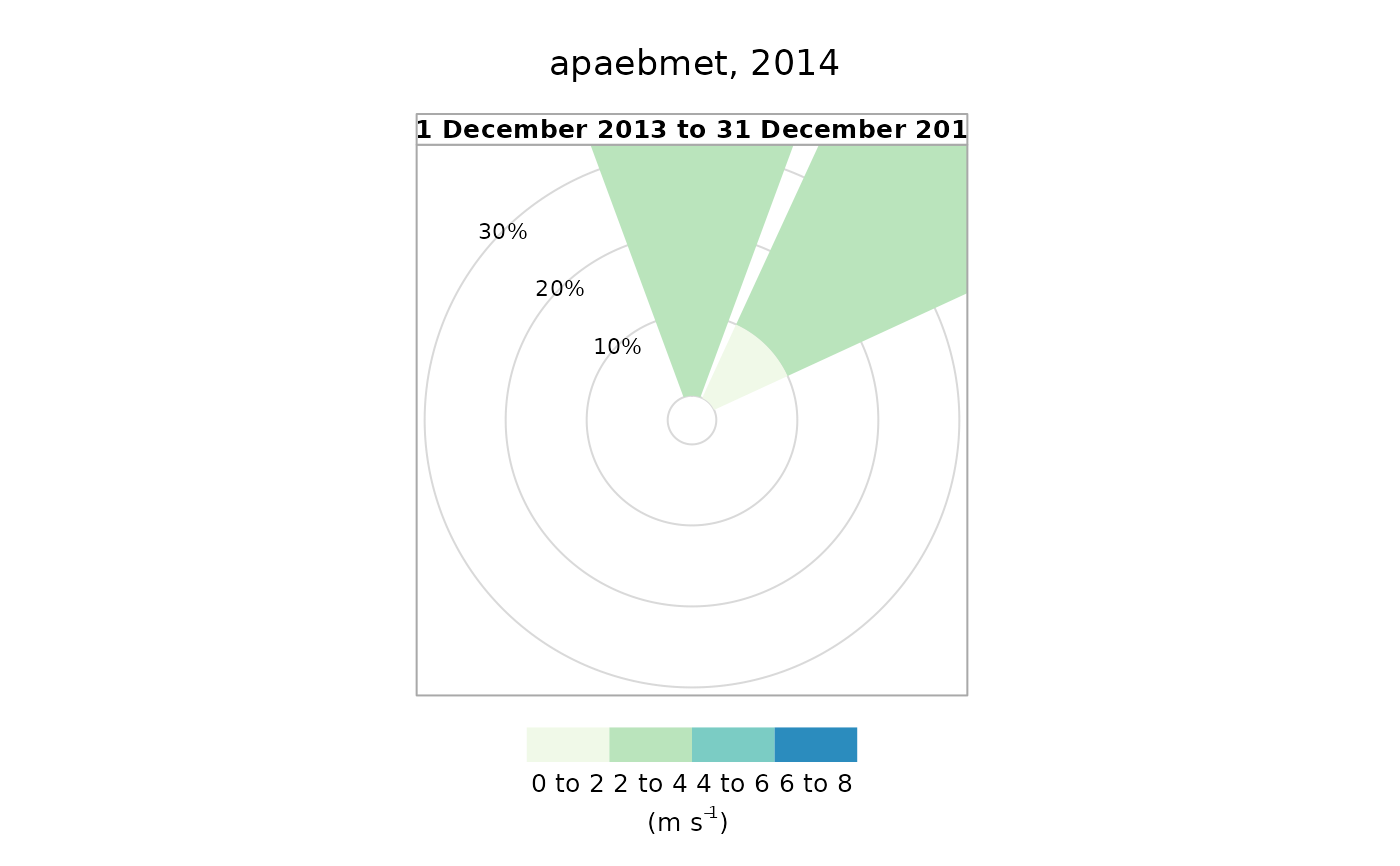
Create a wind rose from met data
Usage
plot_wind(swmpr_in, ...)

# S3 method for class 'swmpr'
plot_wind(
  swmpr_in,
  years = NULL,
  angle = 45,
  width = 1.5,
  breaks = 5,
  paddle = FALSE,
  grid.line = 10,
  max.freq = 30,
  cols = "GnBu",
  annotate = FALSE,
  main = NULL,
  type = "default",
  between = list(x = 1, y = 1),
  par.settings = NULL,
  strip = NULL,
  ...
)
Arguments
- swmpr_in
input swmpr object
- ...
arguments passed to or from other methods
- years
numeric of years to plot, defaults to most recent
- angle
numeric for the number of degrees occupied by each spoke
- width
numeric for width of paddles if
paddle = TRUE- breaks
numeric for the number of break points in the wind speed
- paddle
logical for paddles at the ends of the spokes
- grid.line
numeric for grid line interval to use
- max.freq
numeric for the scaling used to set the maximum value of the radial limits (like zoom)
- cols
chr string for colors to use for plotting, can be any palette R recognizes or a collection of colors as a vector
- annotate
logical indicating if text is shown on the bottom of the plot for the percentage of observations as 'calm' and mean values
- main
chr string for plot title, defaults to station name and year plotted
- type
chr string for temporal divisions of the plot, defaults to whole year. See details.
- between
list for lattice plot options, defines spacing between plots
- par.settings
list for optional plot formatting passed to
lattice.options- strip
list for optional strip formatting passed to
strip.custom
Details
This function is a convenience wrapper to windRose. Most of the arguments are taken directly from this function.
The type argument can be used for temporal divisions of the plot. Options include the entire year (type = "default"), seasons (type = "season"), months (type = "month"), or weekdays (type = "weekday"). Combinations are also possible (see windRose).